


0
US Dollar Index
The US Dollar Index recovered slightly during Monday's North American session after falling to its lowest point since 2022. The index traded around 99.70, attempting to stabilize as investors reacted to signs of rising stagflation risks. The rebound came despite fresh selling pressure on the US dollar. Although the market saw some relief after the US reciprocal tariff extension exemptions, concerns about inflation, consumer confidence and global trade frictions still dominate the market. Technically, downward pressure remains. Despite the sharp decline in the US dollar, Lutnick said he is "not worried about the US dollar." Last week, the US dollar index fell 3% as escalating trade tensions and growth concerns prompted investors to sell US assets. Data on Friday showed that US consumer confidence fell to its lowest point in more than three years in April. The dollar fell against most major currencies, with the depreciation being most pronounced against the euro and the yen.
The US Dollar Index remains under significant pressure, trading below its short-term 20-day simple moving average of 104.77 - a clear sign of ongoing bearish sentiment. At this stage, the bearish tone of the US Dollar Index remains dominant, currently trading below the 100 area. The technical indicator Moving Average Convergence/Divergence (MACD) on the daily chart continues to issue a sell signal, while the 14-day Relative Strength Index (RSI) is at 25.45, reflecting weak momentum. The Momentum (10) reading of -3.303 confirms the continued downside risk. All major moving averages - including the 20-day; 100-day; and 200-day simple moving averages are showing selling pressure. No significant support has been identified below the current range. The technical backdrop suggests that the decline in the US dollar index may not be over yet. Therefore, initial support levels appear at the 2025 low of 99.02 (April 11), followed by 98.52 (early April 2022 low), and 98.35 (76.4% Fibonacci retracement of 93.27 to 114.78) area levels. At the same time, the rebound may push the index back to 100.00{market psychological barrier}, and 100.14{300-week moving average} area. If it breaks, it will rebound to 100.62{low in December last year}, and then further challenge the 101.49{61.8% Fibonacci retracement level} level.
Today, you can consider shorting the US dollar index around 99.80, stop loss: 99.90, target: 99.35, 99.20

WTI spot crude oil
On Thursday (March 27), international oil prices rose slightly as market participants were evaluating the impact of tightening global crude oil supply and the latest US tariffs on the global economy and energy demand.
During the North American trading session on Monday, the price of WTI crude oil on the New York Mercantile Exchange rose to nearly $61.30. Oil prices rose as concerns about the global trade war eased. Investors expect that the trade war will be limited to the United States and China. WTI crude oil prices struggled to capitalize on Friday's modest gains at the start of the new week and attracted fresh selling around $61.60. This was despite a lack of sustained selling amid mixed fundamental signals. Investors remain concerned that the rapidly escalating trade war between the United States and China, the world's two largest economies, will weaken global economic growth. This in turn could weaken fuel demand, which together with concerns about excess supply has acted as a headwind for crude oil prices. However, the downside for the black liquid remains supported by sustained dollar selling. The dovish outlook has led the dollar to fall to its lowest level since April 2022 recently, which is seen as providing support for dollar-denominated commodities. Meanwhile, the possibility that the United States will halt Iranian oil exports has further limited the depth of crude oil's decline and raised some warnings for bearish traders.
The direction of oil prices will depend on the enforcement of Iran sanctions and the performance of global demand data. WTI crude oil fluctuates between $60.00/barrel and $63.00/barrel. If geopolitical risks continue to ferment, oil prices may test further upwards; but if demand data continues to be weak, the market may face correction pressure. The trend of the US dollar and speculative sentiment will remain key variables, and traders need to pay close attention to the latest developments in the EIA inventory report and the international situation. The 14-day relative strength index (RSI) index of the technical chart of the daily chart has adjusted after a sharp drop, but it is still in the negative area {latest reported at 37.50}. It is expected that oil prices can stabilize in the short term. Support is expected to be at $59.06 (last Friday's low) and $57.80. As for resistance, it can be focused on $61.20 {last Friday's high}, then last week's high of $63.64, and $64.20 {the axis of the downward channel of the weekly chart}.
Consider going long on crude oil near 60.80 today, stop loss: 60.60; target: 62.20; 62.40

Spot gold
Gold prices held above $3,200 an ounce on Monday after retreating from intraday all-time highs as uncertainty over overall tariff policies persists, despite U.S. President Trump's announcement to exclude smartphones and computers from the reciprocal tariff list alleviating some market concerns. Gold prices entered a bullish consolidation phase, fluctuating around the 3,210 area, with a new all-time high of $3,245.70 hit during the Asian session on Monday. Although the fundamental backdrop suggests that the path of least resistance for gold remains to the upside. The sharp escalation in U.S.-China trade tensions continues to weigh on investor sentiment and support the safe-haven precious metal, despite U.S. President Trump's decision last week to suspend full reciprocal tariffs for 90 days. Meanwhile, the recent sell-off in the U.S. bond market has raised concerns about weakening confidence in the U.S. economy. In addition, the U.S. central bank is expected to cut borrowing costs at least three times this year. This should be another factor driving non-yielding gold prices, validating the positive outlook.
From a technical perspective, the 14-day relative strength index (RSI) of the daily chart's technical indicator remains above 67, pointing to a slightly overbought state. Therefore, it would be wise to wait for some short-term consolidation or a modest pullback before traders start positioning for a new round of gains. At the same time, any corrective decline can be seen as a buying opportunity around the 3,200 round number mark, and a breakout could lead to a sustained adjustment to $3,175.60 {Friday's low}, below which $3,142 {5-day moving average} could play a supporting role. On the other hand, initial resistance is at $3,300 {market psychological level}, and a new upward trend will point to the $3,350.00 threshold after a breakout.
Consider going long on gold before 3,205 today, stop loss: 3,202; target: 3,230; 3235

AUD/USD
On Monday, the Australian dollar gave up its early strength, falling from the session high near 0.6340 to the 0.6280 area during the North American session. It has since rebounded to around 0.6320 above. This despite concerns over the unresolved US-China tariff dispute. AUD/USD maintained its three-day momentum of rebounding from five-year lows at the open on Monday, with a small gain near 0.6300. The latest rise in the pair is related to the risk-on sentiment that continued during the US trading session on Friday and continued into the early Asian trading on Monday. The market breathed a sigh of relief, digesting the weekend news of the reduction of tariffs on Chinese semiconductor and electronics supply chain imports announced by US President Trump on Sunday night. However, it remains to be seen whether the Australian dollar pair can sustain gains, as the US dollar may also see a mild rebound amid an improved risk profile. The US dollar hit a three-year low against major currencies after the US-China trade war intensified. China's statement also calmed the market, supporting the risk-sensitive Australian dollar.
AUD/USD extended its rebound for the third trading day, approaching the upper limit of intraday fluctuations. Despite today's upward push, the overall technical structure remains fragile. The 14-day relative strength index (RSI) of the daily chart is neutral but slightly bullish around 55.50 and steadily rising. Meanwhile, the MACD is still sending weak signals, printing a new red bar, indicating that sellers have not completely exited. The readings of the final oscillator and stochastics remain neutral, indicating a lack of strong confidence in the trend. From a trend-following perspective, all major moving averages continue to point downwards. The 20-day, and 200-day simple moving averages confirm the continued bearish pressure. Therefore, the short-term key resistance is 0.6240 of the 5-week simple moving average, and the round number mark of 0.6200, and then 0.6181 {last Friday's low}. A breakout and sustained trade above the psychological 0.6300 level, and 0.6306{38.2% Fibonacci rebound}, could open up a stronger bullish correction to 0.6389 (April 3 high), which would open up space directly to 0.6407{30-week moving average}, and 0.6428{50.0% Fibonacci rebound} areas, although the technical bias remains cautious at the moment.
Consider going long AUD before 0.6310 today, Stop Loss: 0.6300; Target: 0.6360; 0.6380

GBP/USD
In a positive start to the new trading week, the British pound has managed to extend its bullish momentum, taking GBP/USD to a multi-day high of around 1.3200. In fact, the British pound rose for the fifth consecutive trading day, supported by the continued downward trend of the US dollar, while US Treasury yields generally fell, with the 10-year Treasury yield also falling. Moreover, the bearish sentiment surrounding the US dollar suggests that the path of least resistance for spot prices remains to the upside. The initial market reaction to US President Trump’s decision last week to suspend comprehensive equal tariffs for 90 days was short-lived against the backdrop of heightened fears of a US recession. This development has dampened confidence in the US economy, given that the US still imports a variety of hard-to-replace materials from China. This, in turn, has weighed on the performance of the US dollar index, which has fallen to its lowest level since April 2022, and continues to provide a tailwind for GBP/USD. Investors see a slightly lower chance of a rate cut by the Bank of England next month. This, along with signs of stabilization in the stock market, has become another factor that has weakened the safe-haven dollar and provided support for GBP/USD.
The short-term technical outlook for GBP/USD is favorable for buyers, as the 14-day relative strength index (RSI) of the technical indicator has returned to the midline and is currently close to 66. Moreover, the pair has re-entered above all major daily simple moving averages, reinforcing the bullish potential. The pair must close the week above the 1.3100 mark to resume its move towards the half-year high of 1.3207. The next upside target for buyers is the psychological level of 1.3300, and the threshold of 1.3305 {last October 2 high}. If the highs fail to hold, sellers may regain control, with immediate support at the psychological level of 1.3100, and the next level will point to the support area of 1.3063 (Monday's low).
Today's recommendation is to go long on GBP before 1.3170, stop loss: 1.3155, target: 1.3240, 1.3250

USD/JPY
The yen attracted new buyers at the beginning of the new week and remained near the highest level reached against the broadly weakening US dollar since the end of September 2024. Concerns about the rapid escalation of the US-China trade war and its impact on the global economy continue to support traditional safe-haven assets, including the yen. In addition, hopes that Japan may reach a trade deal with the United States is another factor supporting the yen. Meanwhile, signs of inflation in Japan are expanding, opening the door for further rate hikes from the Bank of Japan. On the contrary, investors have begun pricing in the possibility of aggressive policy easing by the Federal Reserve amid concerns that an escalation in the US-China trade war will hamper US economic growth. This will lead to a further narrowing of the interest rate differential between Japan and the United States, which suggests that the path of resistance for the low-yielding yen is to the upside.
From a technical perspective, the 14-day relative strength index (RSI) on the daily chart is about to break through the oversold zone, which requires some caution for bearish traders. Meanwhile, the 142.00 mark, as well as the multi-month low of 142.25 hit on Monday, may provide some initial support for the USD/JPY exchange rate. If it breaks below, it may drag the spot price to the intermediate support of 141.65-141.60, and then point to the 141.00 mark. Further follow-up selling below the 140.75 area may expose the short-term ultimate target to the psychological level of 140.00, and the 139.58 {last September 16 low} area level. On the other hand, any attempt to rise back to the vicinity of 143.50-143.55 area will encounter strong resistance. The subsequent rise may push the USD/JPY exchange rate to the high of the Asian session, around the round mark of 144.00, and if it breaks through effectively, it may trigger a short-term covering rebound to the 144.50 level.
Today, it is recommended to short the US dollar before 143.30, stop loss: 143.50; target: 142.30, 142.10

EUR/USD
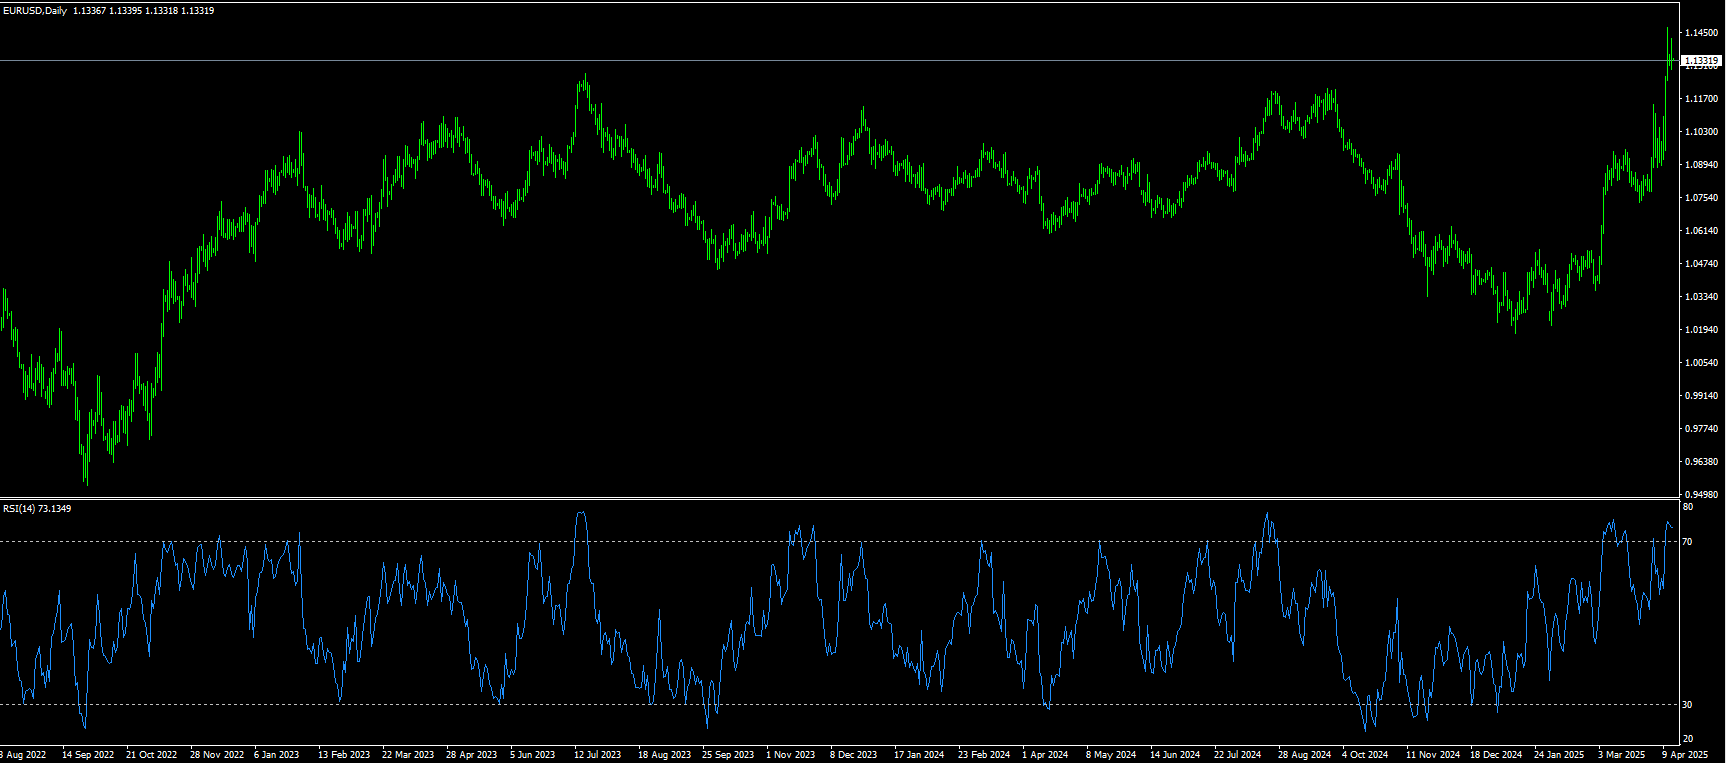
During the Asian trading session on Monday, the EUR/USD fell slightly, hovering around 1.1390, after two trading days of gains. The currency pair appreciated due to the weakening of the US dollar, which came under pressure against the backdrop of escalating US-China trade tensions, reigniting concerns about a global recession. China raised tariffs from 84% to 125%. The move was a response to US President Trump's decision the day before to increase tariffs on Chinese imports to 145%. At the same time, in order to ease trade frictions, the European Union announced a 90-day suspension of planned retaliatory tariffs, echoing a similar suspension in Washington to encourage renewed dialogue. The US dollar index continued its decline for the third consecutive trading day, falling below 100.00 and approaching Friday's three-year low. The continued decline reflects the decline in investor confidence, accompanied by weak economic indicators and dovish central bank comments. This is extremely bullish for the euro in the short term.
The daily chart shows that technical indicators are showing a strong bullish pattern, although some cautious signals have emerged. The 14-day relative strength index (RSI) is 77.40, suggesting extremely overbought conditions, while the MACD continues to send a clear buy signal. Indicating that momentum may stabilize in the short term. The overall trend remains positive, supported by the rising moving averages. The 20-day at 1.0930, and the 200-day simple moving average at 1.0741, both suggest continued upward pressure. Further reinforcing the ongoing bullish momentum. Looking ahead, support levels are 1.1300 {round mark}. 1.1222 {61.8% Fibonacci rebound from 1.2266 to 0.9535}, and 1.1200 (round mark). On the upside, if the bullish breakout holds, traders may look for a move towards 1.1483 {January 28, 2022 high}. If it breaks, it will look towards 1.1621 {76.4% Fibonacci rebound level}.
Today it is recommended to go long on Euro before 1.1335, stop loss: 1.1320, target: 1.1395, 1.1410.
Disclaimer: The information contained herein (1) is proprietary to BCR and/or its content providers; (2) may not be copied or distributed; (3) is not warranted to be accurate, complete or timely; and, (4) does not constitute advice or a recommendation by BCR or its content providers in respect of the investment in financial instruments. Neither BCR or its content providers are responsible for any damages or losses arising from any use of this information. Past performance is no guarantee of future results.
Lebih Liputan


Pendedahan Risiko:Instrumen derivatif diniagakan di luar bursa dengan margin, yang bermakna ia membawa tahap risiko yang tinggi dan terdapat kemungkinan anda boleh kehilangan seluruh pelaburan anda. Produk-produk ini tidak sesuai untuk semua pelabur. Pastikan anda memahami sepenuhnya risiko dan pertimbangkan dengan teliti keadaan kewangan dan pengalaman dagangan anda sebelum berdagang. Cari nasihat kewangan bebas jika perlu sebelum membuka akaun dengan BCR.

 English
 简体中文
简体中文
 繁體中文
繁體中文
 Bahasa
Melayu
Bahasa
Melayu
 Tiếng
Việt
Tiếng
Việt
 ไทย
ไทย
 日本語
日本語
 한국어
한국어
 ភាសាខ្មែរ
 español