


0
US Dollar Index
The US Dollar Index came under pressure on Wednesday, trading in the 99.50 area, as risk aversion tilted investors towards safe haven assets such as gold. This occurred on the back of better-than-expected US retail sales data, which rose 1.4% month-on-month to $734.9 billion in March, beating expectations by 1.3%. The annual growth rate was 4.6%, showing resilience in consumer activity. However, market attention remained focused on trade tensions after US President Trump launched a new investigation into tariffs on key mineral imports - seen as retaliation for China's escalating non-tariff measures and export controls. Investors remained cautious. The fluctuating tariff policy has reduced confidence in US policymakers, leading investors to seek calmer waters outside the United States, which spurred a sharp rise in US Treasury yields last week and weakened the appeal of the US dollar. The US dollar was mainly driven by asset flows rather than traditional short-term drivers such as interest rate differentials. Factors driving the move away from the United States include: a slowing US economy, uncertainty about tariffs, broader US policy uncertainty, and improved confidence in Europe. Trading has been relatively quiet so far this week.
Despite a small rebound mid-week, the US Dollar Index remains in a technically vulnerable state. The 14-day relative strength index (RSI) of the daily chart is currently at 26.19, suggesting a possible reversal from the oversold area. However, at the same time, the moving average convergence/divergence (MACD) still sends a sell signal, indicating that the overall bearish trend remains. The key moving averages further reinforce the downward trend: the 20-day; 100-day; and 200-day simple moving averages are all trending down. The next major resistance area represents 100.62 {last December low}, and then further upwards to challenge the 101.00 {round number} level. Initial support levels are 99.02 (April 11 low), then 98.52 (early April 2022 low), and 98.35 (76.4% Fibonacci retracement level from 93.27 to 114.78) area levels.
Today, consider shorting the US dollar index around 99.40, stop loss: 99.50, target: 99.00, 98.85

WTI spot crude oil
On Thursday (March 27), international oil prices rose slightly as market participants were evaluating the impact of tightening global crude oil supply and the latest US tariffs on the global economy and energy demand.
WTI crude oil rebounded above $61.60 a barrel on Wednesday as hopes for a restart of US-China trade talks offset bearish supply and demand signals. China said it was willing to negotiate but hoped Washington would make key changes, including more respectful wording and a clear negotiator supported by Trump. This boosted optimism about easing trade tensions and supported oil prices. Investors digested the latest news about US President Trump's back-and-forth tariff policy and tried to sort out the extent to which the trade war would reduce global economic growth and oil demand. Investors digested the latest news about US President Trump's back-and-forth tariff policy and tried to sort out the extent to which the trade war would reduce global economic growth and oil demand. On the other hand, the International Energy Agency (IEA) similarly forecasts that global oil demand is expected to grow at the slowest pace in five years in 2025 due to concerns that Trump's trade tariffs will affect economic growth.
WTI crude oil prices are consolidating, but with demand forecasts being revised down and global trade risks unresolved, all signs point to a bearish market outlook in the short term. Positive data from China and occasional geopolitical news may slow the pace of oil price declines, but traders seem reluctant to chase higher without clearer demand stimulus. Prices fell slightly midweek, maintaining a narrow range between key technical levels. Traders are waiting for a decisive move: either a breakout of the $63.64 {last week's high} resistance level, which could trigger a test of the $64.20 {weekly chart downtrend channel center axis}, and the $65.44 {20-day simple moving average; or a break below the $60.00 support level, opening the door to retest $59.06 (Friday's low) and the recent low of $54.78.
Consider going long on crude oil near 61.65 today, stop loss: 61.50; target: 62.90; 63.00

Spot gold
On Wednesday, spot gold prices hit a record high of $3,343 in the early North American trading session. Technical indicators showed signs of overbought, and some traders chose to take profits before the speech of Federal Reserve Chairman Powell. However, continued trade uncertainty and expectations that the Federal Reserve may implement more aggressive interest rate cuts in 2025 may continue to support the performance of this safe-haven asset. With traditional safe havens collapsing and U.S. stocks teetering on historical extreme valuations, gold prices breaking through $3,300 an ounce may be just the beginning of a larger move that may look towards $4,000. Market liquidity may decline before the Good Friday holiday, and any sudden policy changes may trigger sharp fluctuations. Although the bond market panic has been temporarily alleviated, the shadow of the largest weekly increase in 10-year U.S. Treasury yields since 2001 last week still lingers in the market. Traders need to be alert to the chain reaction that may be triggered by the unwinding of basis trades.
Gold prices hit another all-time high at $3,343 in the middle of the week. At this stage, the outlook for gold prices is positive as the short-term {20-day}; medium-term {100-day}; and long-term {200} exponential moving averages are all sloping upwards and are currently trading above $3,340. The 14-day relative strength index (RSI) of the daily chart technical indicator is trading above 74.98, indicating strong bullish momentum, indicating that short-term momentum is still bullish. If gold prices can continue to hold above the $3,250-3,280 area, bulls may further challenge the higher level of $3,350, and a breakout will point to the higher level of $3,400 {historical psychological barrier}. Currently, the support of $3,280 is strong. If the gold price fails in the future, it will usher in a new wave of technical adjustments to $3,230 {Wednesday low} and the $3,200 round number support area. Below this level, $3,150 {April 1 high} may play a supporting role.
Consider going long on gold before 3,338 today, stop loss: 3,334; target: 3,355; 3360

AUD/USD
On Wednesday, the Australian dollar resumed its gains during the US session, rising to the 0.6391 area, as improved risk sentiment and a generally weaker US dollar helped AUD/USD to escape recent losses. The early gains were driven by optimism about China's GDP, which grew 5.4% year-on-year in the first quarter, exceeding expectations. However, the rebound remains fragile due to continued US-China trade tensions and the role of the Australian dollar as a substitute for Chinese demand. AUD/USD remained above $0.6300 on Wednesday, looking forward to a sixth consecutive trading day of gains as strong economic data from China supported risk sentiment. As China is Australia's largest trading partner and a major buyer of its commodities, upbeat Chinese economic indicators have helped support the currency despite the shadow of geopolitical uncertainty. However, trade tensions have re-emerged as US President Trump ordered an investigation into possible new tariffs on all critical mineral imports, heightening concerns that the US imports many critical minerals from China. On the domestic front, traders are looking forward to Thursday's employment data for further insights into the strength of the labor market and potential implications for the direction of the Reserve Bank of Australia's policy.
AUD/USD hovered around the 0.6350 level on Wednesday, while the 14-day relative strength index (RSI), a technical indicator on the daily chart, has risen above the 50 level {latest around 58.43}, further strengthening the positive momentum. Pointing to a bullish bias. The pair continues to trade above the 20-day {0.6243} and 50-day {0.6285} moving averages. On the upside, a break above the psychological barrier of 0.6400 could pave the way for a retest of the four-month high of 0.6408, last seen on February 21, and 0.6407{30-week moving average}, which could open up the upside to the 0.6428{50.0% Fibonacci rebound} area. As for initial support, the 50-day moving average is at 0.6285, followed by the 20-day moving average at 0.6243. A clear break below these levels would challenge the short-term bullish structure and could open the way to the 0.6200 area.
Consider going long on AUD before 0.6358 today, stop loss: 0.6345; target: 0.6420; 0.6430

GBP/USD
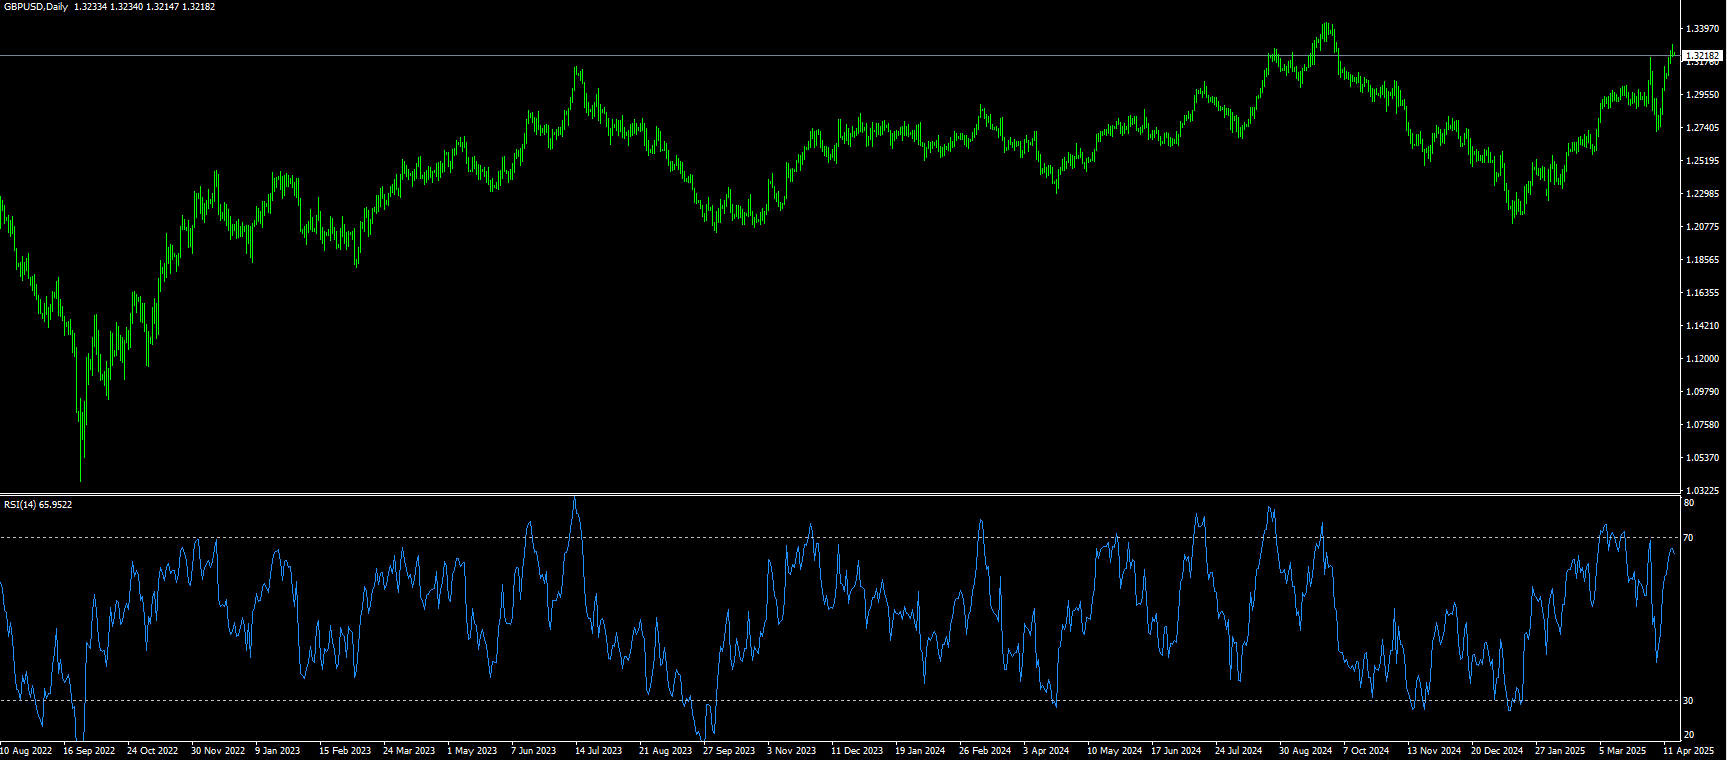
During the North American trading session, the British pound rose as inflation fell to its lowest level in three months. This increased pressure on the Bank of England to cut interest rates. GBP/USD is trading at 1.3248, having hit an intraday high of 1.3291, and refreshed a six-month high against the US dollar as the narrative in financial markets remains tied to the imposition of tariffs by the US. GBP/USD shrugged off the weak UK employment data, and as a result, the GBP/USD pair attracted buying for the sixth consecutive day, climbing above 1.3200. Moreover, the bearish sentiment surrounding the US dollar suggests that the path of least resistance for spot prices remains to the upside. Investors are concerned about the possible economic impact of the escalating US-China trade war. In fact, China on Friday raised tariffs on US imports to 125% in retaliation to US President Trump's decision to increase tariffs on Chinese goods to an unprecedented 145%. The US still imports several materials from China that are difficult to replace, a development that has weakened confidence in the US economy, in turn keeping US dollar bulls on the defensive and providing support for the GBP/USD pair.
Even from a technical perspective, the continued breakout and acceptance of levels above 1.3100 at the beginning of the week validates the positive outlook in the short term. As far as momentum indicators are concerned, the 14-day relative strength index (RSI) of the technical indicators on the daily chart shows a strong bullish stance close to 68, while the average directional index (ADX) around 27 indicates that the strength of the trend is moderate. Therefore, a subsequent test of the next relevant resistance level close to 1.3274 {last October 4 high}, and the 1.3300 {market psychological level} area seems to be a distinct possibility. At present, a break above the 1.3300 level will likely visit the 2024 high of 1.3434 (September 26). On the downside, the immediate support is at the market psychological level of 1.3100, and the next level will point to the 1.3063 (Monday's low) support area. Further down, the psychological level of 1.3000 will be tested.
Today, we recommend going long GBP before 1.3230, stop loss: 1.3220, target: 1.3280, 1.3290
USD/JPY
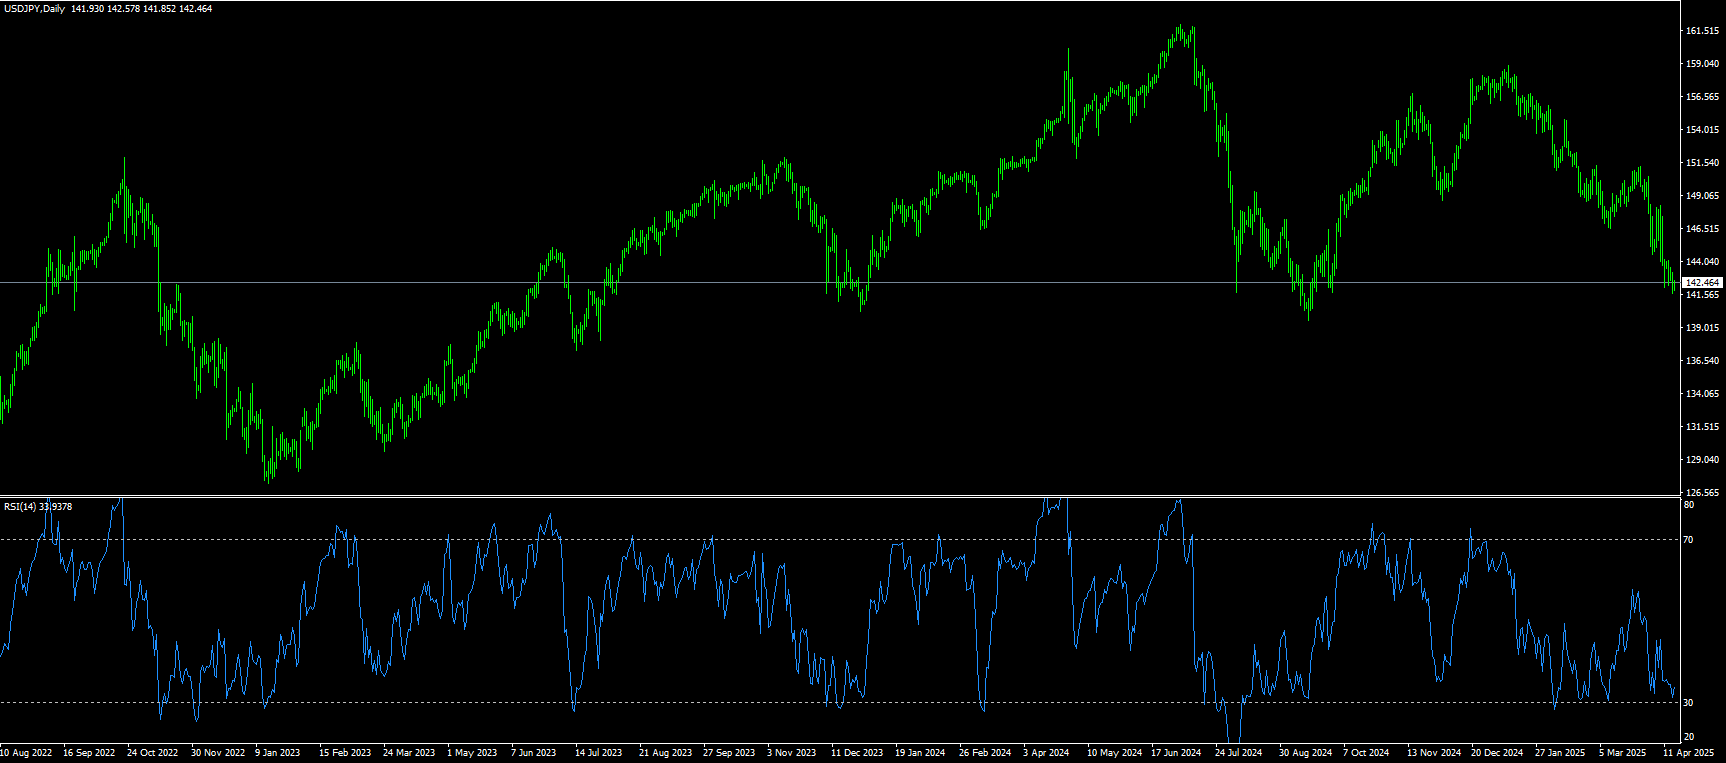
During Wednesday's North American session, USD/JPY maintained a modest line bias, hovering near the 142 mark. As the US dollar continues to be under pressure from escalating trade tensions and falling Treasury yields. The yen usually acts as a safe haven currency during geopolitical conflicts. USD/JPY rose slightly on Tuesday, hovering in the 143 area, slightly higher in the intraday range. This modest intraday rebound occurred before the Asian session, but has not yet challenged the broader bearish signals dominating the chart. The positive impact on market sentiment remained after US President Trump suspended tariffs on key consumer electronics and said that the automotive industry may be temporarily exempted from the 25% tariff. This in turn was seen as weakening demand for traditional safe-haven assets, including the yen. However, the rapidly escalating US-China trade war and continued concerns about the possible economic consequences of Trump's damaging tariffs should curb market optimism. Meanwhile, the market is expecting the Bank of Japan to continue hiking rates, creating a clear divergence with expectations of more aggressive policy easing from the Federal Reserve. This, coupled with expectations for a US-Japan trade deal, should limit losses in the low-yielding yen.
From a technical perspective, any subsequent gains are likely to face strong resistance and limit USD/JPY gains around 143.00, or the overnight swing high. However, a sustained strong breakout could trigger a short-term covering rally and push the spot price to the 143.45-144.50 level, heading towards the 144.00 psychological level. Momentum could extend further to the 1454.50 area and the 145.00 round number. On the other hand, a drop back below 142.00 seems to find some support in the 141.25-141.20 area, followed by the 140.00 psychological level. If it is broken, it will be seen as a new trigger for bearish traders and drag the USD/JPY pair towards the 139.58 mark (September 2024 low).
Today, it is recommended to short the US dollar before 142.10, stop loss: 142.30; target: 141.00, 140.80
EUR/USD
During the European trading session on Wednesday, EUR/USD rebounded strongly to near 1.1415 after a slight correction on Tuesday. The major currency pairs strengthened as the US dollar resumed its downward trend after a brief rebound. Financial market participants expect further weakness in the US dollar and further gains in EUR/USD as doubts about the structural attractiveness of the US dollar due to President Trump's repeated tariff announcements grow.
ING analysts believe that EUR/USD will rise to 1.1500 due to the "diminishing appeal of the US dollar as a reserve and safe-haven asset", while "high liquidity in the euro" is expected to "absorb a large amount of funds transferred from the US dollar". Last week, Trump announced a 90-day suspension of the implementation of reciprocal tariffs on goods other than China. Trump raised additional tariffs on Chinese imports to 145% in retaliation for reciprocal tariffs.
Since breaking above the 200-day simple moving average near 1.0744 in early March, the EUR/USD pair has been plagued by stagnant momentum and the bull market has been slow to progress. The technical bias currently remains in favor of buyers, with the 14-day relative strength index (RSI) hovering around 74.27, still in overbought territory, while the ADX above 41 indicates a moderately strong trend that may support a continued bullish bias. Upside targets suggest that the first hurdle is located at the 2025 high of 1.1473 (April 11). A decisive break above this level could open the way to the 2022 high of 1.1498 (February 19), followed by the 1.1500 round number. On the downside, first focus on key supports at 1.1300 (market psychological level), and 1.1222 {61.8% Fibonacci rebound level from 1.2266 to 0.9535}, then 1.1200 (round number).
Today it is recommended to go long on Euro before 1.1385, stop loss: 1.1370, target: 1.1440, 1.1450.

Disclaimer: The information contained herein (1) is proprietary to BCR and/or its content providers; (2) may not be copied or distributed; (3) is not warranted to be accurate, complete or timely; and, (4) does not constitute advice or a recommendation by BCR or its content providers in respect of the investment in financial instruments. Neither BCR or its content providers are responsible for any damages or losses arising from any use of this information. Past performance is no guarantee of future results.
Lebih Liputan


Pendedahan Risiko:Instrumen derivatif diniagakan di luar bursa dengan margin, yang bermakna ia membawa tahap risiko yang tinggi dan terdapat kemungkinan anda boleh kehilangan seluruh pelaburan anda. Produk-produk ini tidak sesuai untuk semua pelabur. Pastikan anda memahami sepenuhnya risiko dan pertimbangkan dengan teliti keadaan kewangan dan pengalaman dagangan anda sebelum berdagang. Cari nasihat kewangan bebas jika perlu sebelum membuka akaun dengan BCR.

 English
 简体中文
简体中文
 繁體中文
繁體中文
 Bahasa
Melayu
Bahasa
Melayu
 Tiếng
Việt
Tiếng
Việt
 ไทย
ไทย
 日本語
日本語
 한국어
한국어
 ភាសាខ្មែរ
 español